After a winter marked by storms, flood warnings and severe weather alerts, new analysis from Ordnance Survey (OS) has identified the road and rail pinch points across England most vulnerable to river and sea flooding, highlighting how climate-related events could isolate communities, disrupt critical transport networks, and leave England’s towns and cities partially, or completely cut off during extreme weather events.
Britain’s transport network underpins national productivity, yet new geospatial analysis reveals the growing scale of its exposure to flooding. This analysis combines the latest Environment Agency flood data with OS’s National Geographic Database to map rail lines and road access routes to local communities, while accounting for the presence and impact of flooding defences. The results pinpoint the commuter corridors, economic routes and access points most vulnerable to river and sea flooding. These assets sit within high-probability flood zones defined as areas with a 1-in-1,000 annual chance of flooding during extreme weather events, with modelling that accounts for flood defences
At a national level, the scale of exposure across England’s transport network is clear. An estimated 7,564 total road kilometres (12% of the nation’s total) and 3,003 total rail kilometres (20% of England’s rail network) intersect this highest-risk flood boundary for river and sea flooding.
North Yorkshire is recorded as the most vulnerable local authority to flooding, with 102 km of road exposed to river flooding, and 49 km of road networks exposed to sea flooding; the most of all local authorities in England in both defined boundaries.
Thirty-six local authorities are at risk of complete rail isolation. Kirkby-in-Furness, Collaton St Mary, Swinefleet, Belton, Bradwell and Burgh Castle could face being cut off by sea flooding. Key commuter lines in Marlow and Henley-on-Thames remain susceptible to isolation through river flooding.
A total of 587km of England’s motorways fall within the highest-risk flood zones. Routes most exposed include the A38, where 12% of its total length is considered vulnerable to flooding by river; followed by the M45 (9%), the M32 (9%), and the A58 (8%).
Community-level analysis reveals the scale of potential isolation facing towns and cities across England. More than 1,000 “built-up areas” have been identified where all of their access roads (100%) are at risk of river flooding, leaving them at risk of shutdown during severe flood events.
In Greater London, four areas appear most vulnerable to transport isolation through river flooding. Kingston upon Thames ranks highest in the capital, with 29 of its 40 access roads vulnerable to river flooding - equivalent to 73% of its routes in and out of the borough. Sutton (51%), Waltham Forest (45%), and Hounslow (38%) similarly rank highly.
Greater Manchester faces even greater exposure than the capital. Salford records 43 at-risk access roads, comprising 66% of its total road infrastructure. In Old Trafford, 41 roads (67%) are exposed, while in central Manchester, 40 access roads (45%) remain vulnerable to severe flooding events.
Exposure extends to rail connectivity. Thirty local authorities face the risk of complete rail isolation from river flooding, even after accounting for the presence and impact of flood defences. Commuter branch lines into London from Marlow and Henley-on-Thames are among those identified. Other commuter and regional rail hubs remain exposed, including Penzance (71%), King’s Lynn (71%), Walsall (67%), Stamford (66%), Exeter (65%) and York (52%), where significant proportions of rail infrastructure lie within the highest-risk flood zone.
Motorways are similarly exposed. OS analysis reveals that an estimated 587km of England’s motorways intersect with the highest-risk river flooding boundary. The motorways most exposed include the A38, with 12% of its total length considered vulnerable to flooding by river; the M45 (9%), the M32 (9%), and the A58 (8%).
Disruption at these locations could sever critical links between homes, workplaces and regional economic centres, highlighting the increasing pressure that flooding risk places on the resilience and reliability of England’s road and rail networks.
Tidal and sea flooding further compound connectivity risks. A total of 94 local authorities have been identified where 100% of access roads are located within the highest risk flooding zone. North, South and the East Riding of Yorkshire feature prominently in this assessment, with 30 local communities on this list.
Newham in Greater London records the highest number of access roads at risk of flooding isolation (16), with 24% of its routes in and out of the borough at risk of isolation through tidal flooding. Barking and Dagenham (38%), Redbridge (25%), Greenwich (20%), and Tower Hamlets round off the areas with the most access roads at risk of flooding in the highest risk flooding zone, reflecting continued exposure along the tidal Thames and associated river corridors.
Rail infrastructure shows a similar pattern of exposure. Kirkby-in-Furness (Cumbria), Collaton St Mary (Devon), Swinefleet (East Riding of Yorkshire), and Belton, Bradwell and Burgh Castle in Great Yarmouth have been identified as having 100% of their rail access located within the highest risk flooding zone. High levels of exposure are also recorded in other economically significant towns, including Penzance (92%), Selby (65%) and Dawlish (53%), as well as key commuter lines from Great Yarmouth (87%) and Exmouth (77%).
Concentrated risk at these locations highlights the vulnerability of rail connectivity in flood-prone areas. Disruption here could constrain labour mobility, interrupt freight flows and weaken regional economic resilience.
The findings reveal the exposure of key commuter, freight and economic links to flooding risk, and underline the increasing importance of high-quality geospatial data in targeting investment to strengthen network resilience and safeguarding communities, to keep England safe and moving as flood risk continues to intensify.


DIVE RIGHT IN
Sign up to our newsletter
Tom Gray, Transport Market Development Lead at Ordnance Survey, said: “Disruption from flooding on rail and road networks is increasing as climate change continues, turning what was once an occasional challenge into a persistent planning reality. In this context, the ability of central government, local authorities and planners to rely on comprehensive, accurate geospatial insights is essential to reduce risk, protect communities and strengthen long-term resilience.”
He adds: “With economic growth increasingly driven by new housing, infrastructure and major construction projects, investment is flowing into assets that must be resilient from day one. These projects depend on secure funding, compliance with climate resilience regulations, ESG reporting metrics, appropriate insurance and effective mitigation measures - all of which require a clear, forward-looking understanding of environmental risk.”
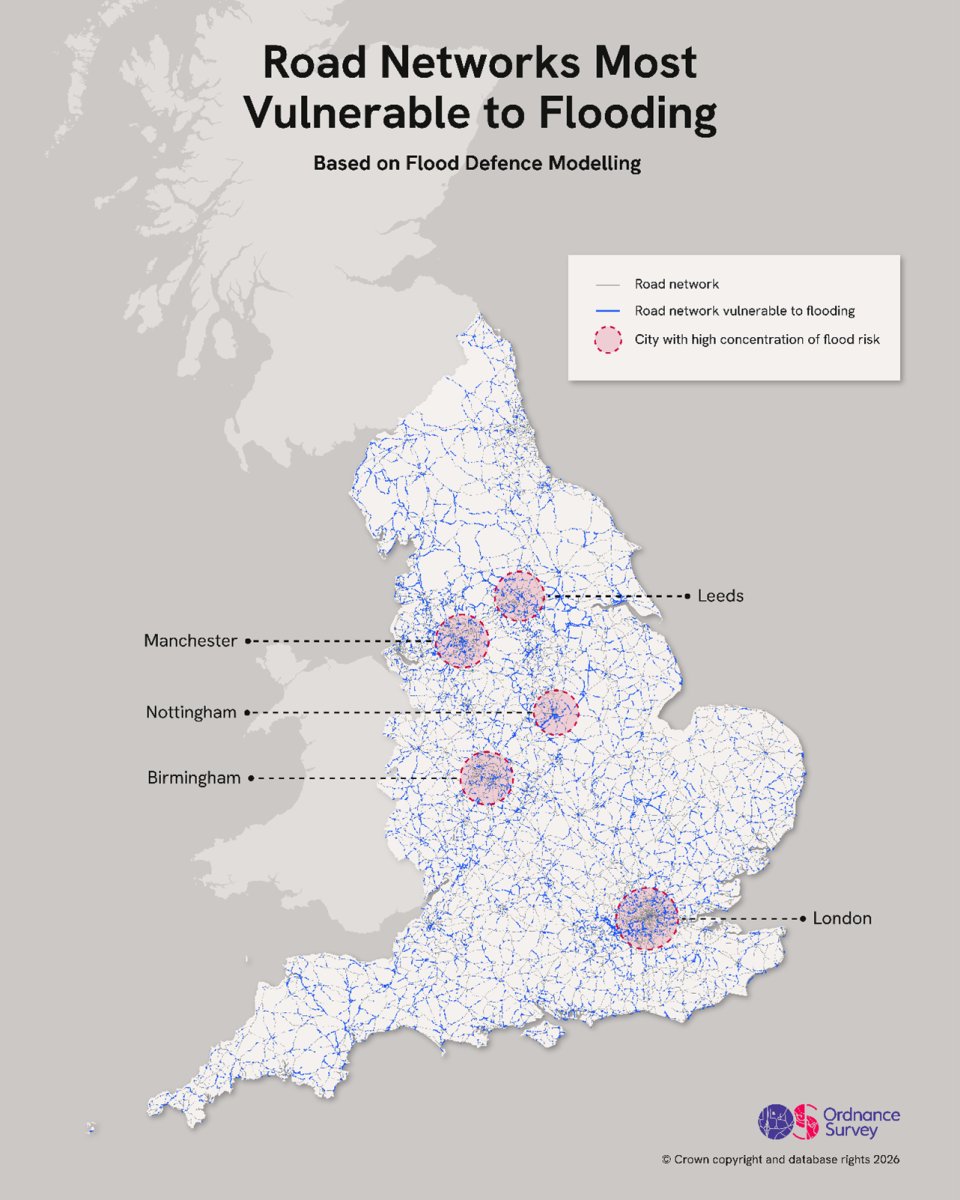
[Fig. 1. Road networks identified as intersecting the highest-risk flooding boundaries in England, with a 1-in-1000 chance of flooding, accounting for the impact of defences]
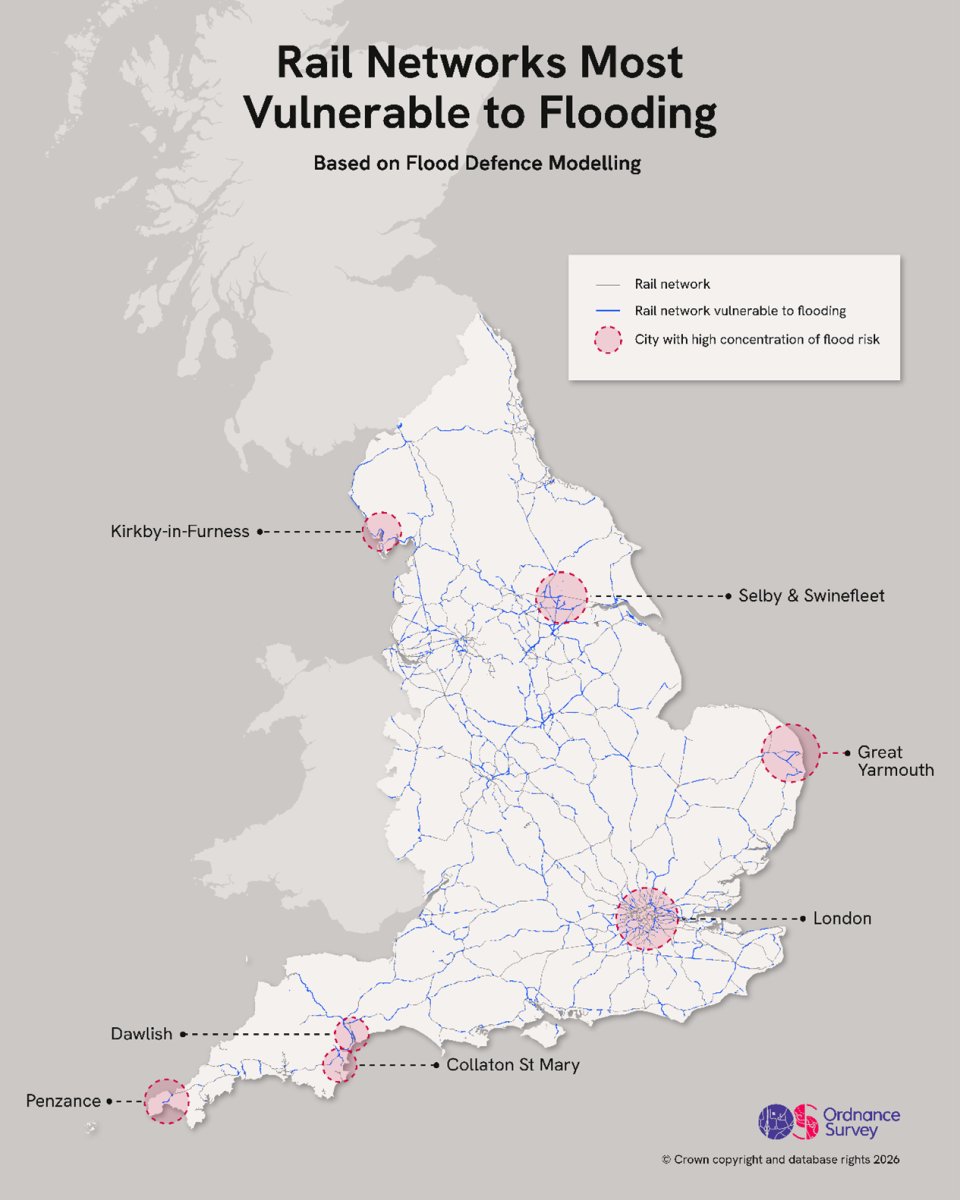
[Fig. 2. Rail networks identified as intersecting the highest-risk flooding boundaries in England, with a 1-in-1000 chance of flooding, accounting for the impact of defences]
Methodology
This analysis combines the latest Environment Agency flood data with OS’s National Geographic Database to map road and rail lines, as well as road access routes to local communities, while accounting for the presence and impact of flooding defences in its modelling.
These assets sit within high-probability flood zones defined as areas with a 1-in-1,000 annual chance of flooding during extreme weather events. This analysis does not account for precise local topography, such as hills, or the slope angle of infrastructure. Data is broken down into flooding defined by the Environment Agency as an area with a recorded source from Rivers, and by Sea, combining conventionally termed flood zone 2 (medium 1-in-100 probability of flooding) and flood zone 3 (high 1-in-1000 probability of flooding).
Attribute: road/rail_flood_percent
If a section or polyline of road or rail network intersects a flood boundary, then the complete polyline is flagged as 'yes'. The length of these polylines are divided by the total length of the polylines to get the road or rail flood percentage. The percentage is not the length of road or rail in flood boundaries, but the length of the network flagged as flooded during extreme weather events. A section or polyline is a length of road or rail that is between two junctions/ bridges/ intersections/ turnings and can vary in length from a few metres to a number of kms depending on where you are in the country.
Attributes: road statistics
Road networks are grouped by their road classification, i.e. M3, M6, A43, B12, which enter a ‘built up area’, and this is classed as 1 road included in its ‘total roads’ count. If any section of the complete road intersects a flood boundary, it is counted as disrupted by flooding and flagged as 'yes'. The percentages are then derived from the road networks that intersect road flooding, divided by the roads that are entirely unflooded during extreme weather events.